美国经济
就业和物价
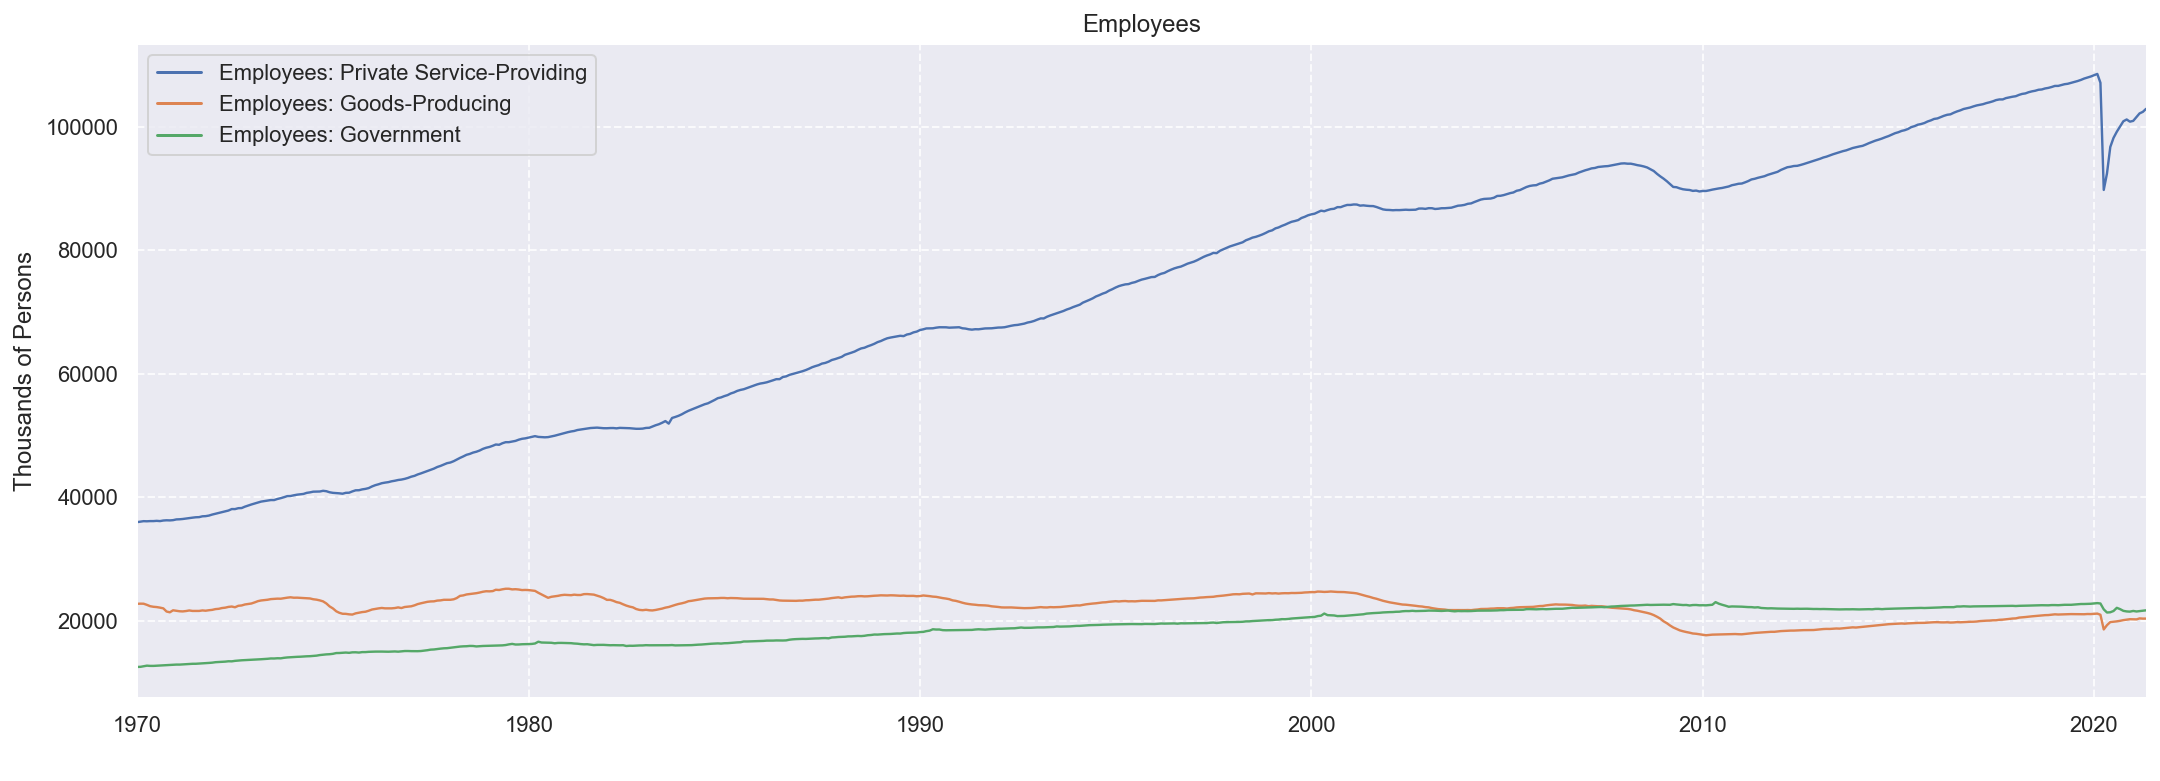
就业人口
总就业人口
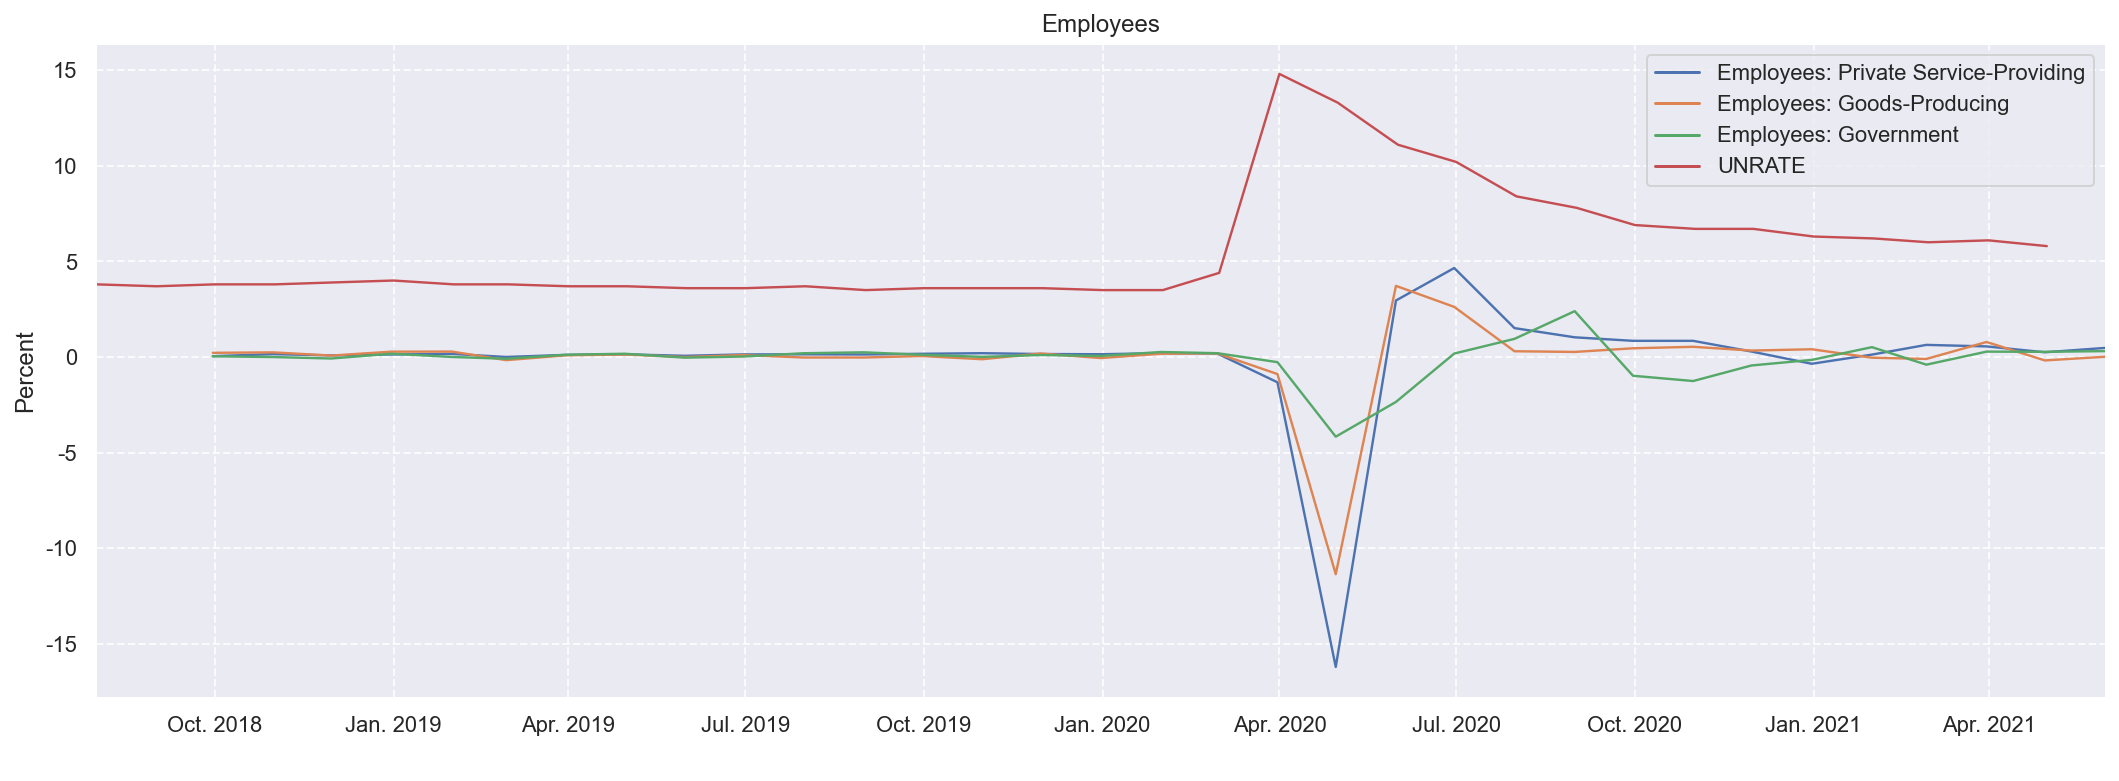
就业人口变化与失业率
物价
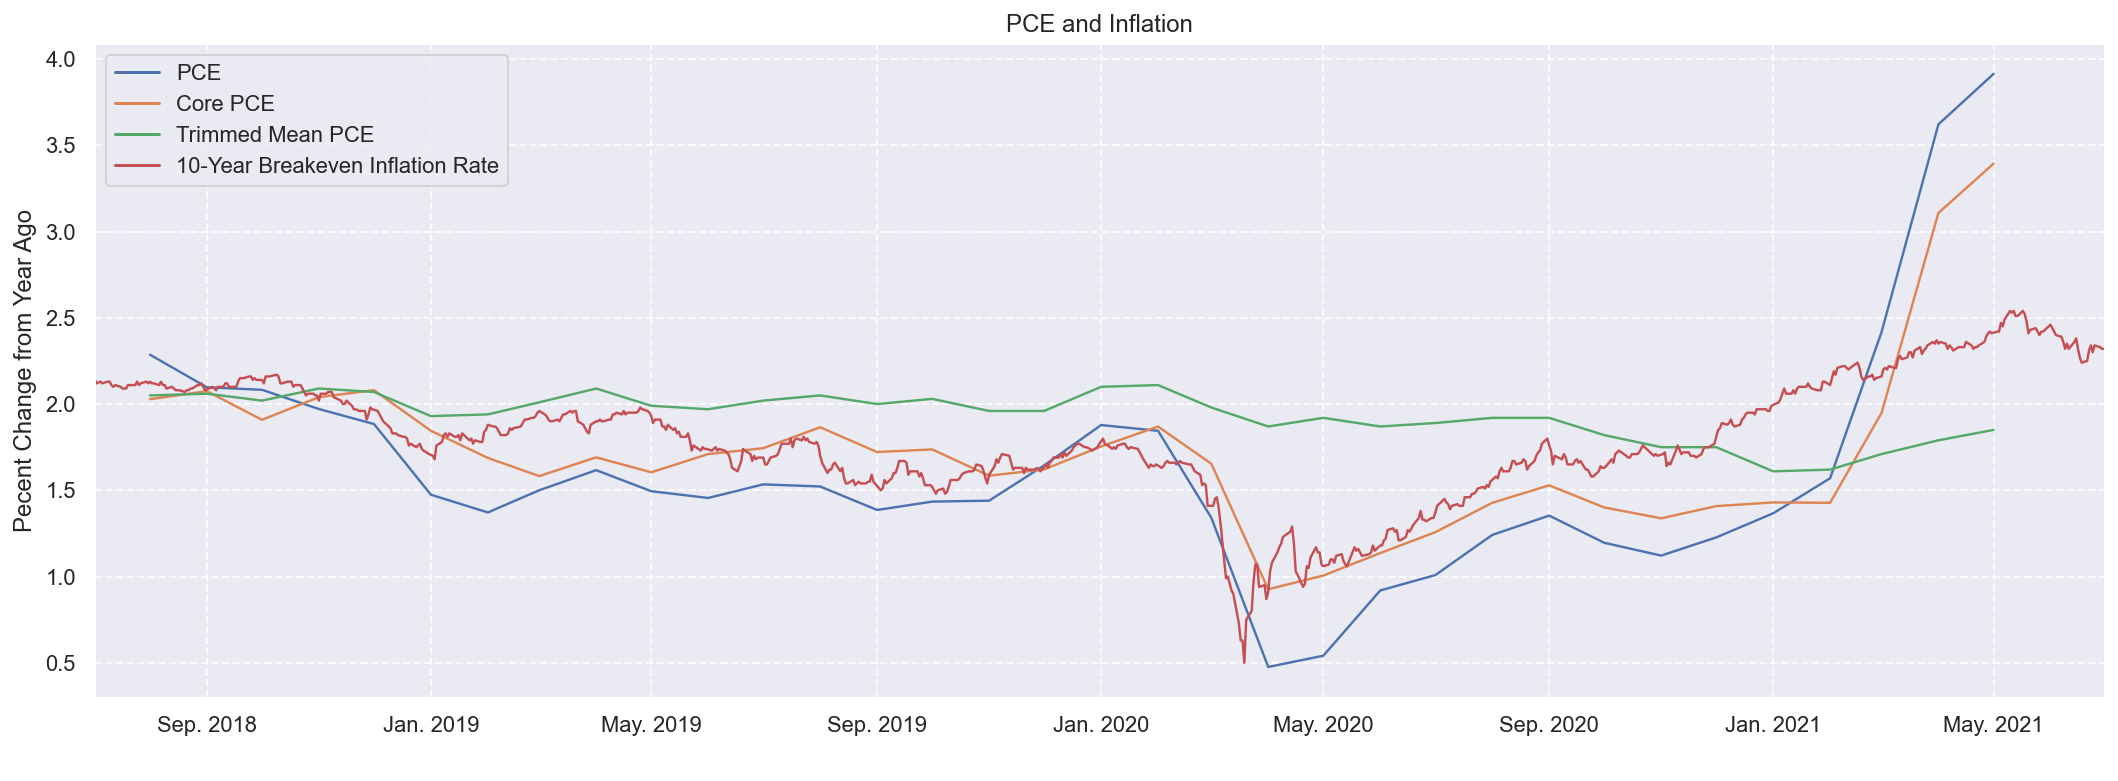
- Measuring inflation trends: Why use different inflation measures for policy analysis? Congress has instructed the Federal Reserve to pursue monetary policies that promote maximum employment and price stability. The Federal Open Market Committee (FOMC) has determined that “inflation at the rate of 2 percent, as measured by the annual change in the price index for personal consumption expenditures [PCE], is most consistent over the longer run with the Federal Reserve’s statutory mandate” for price stability.
GDP
GDP总量
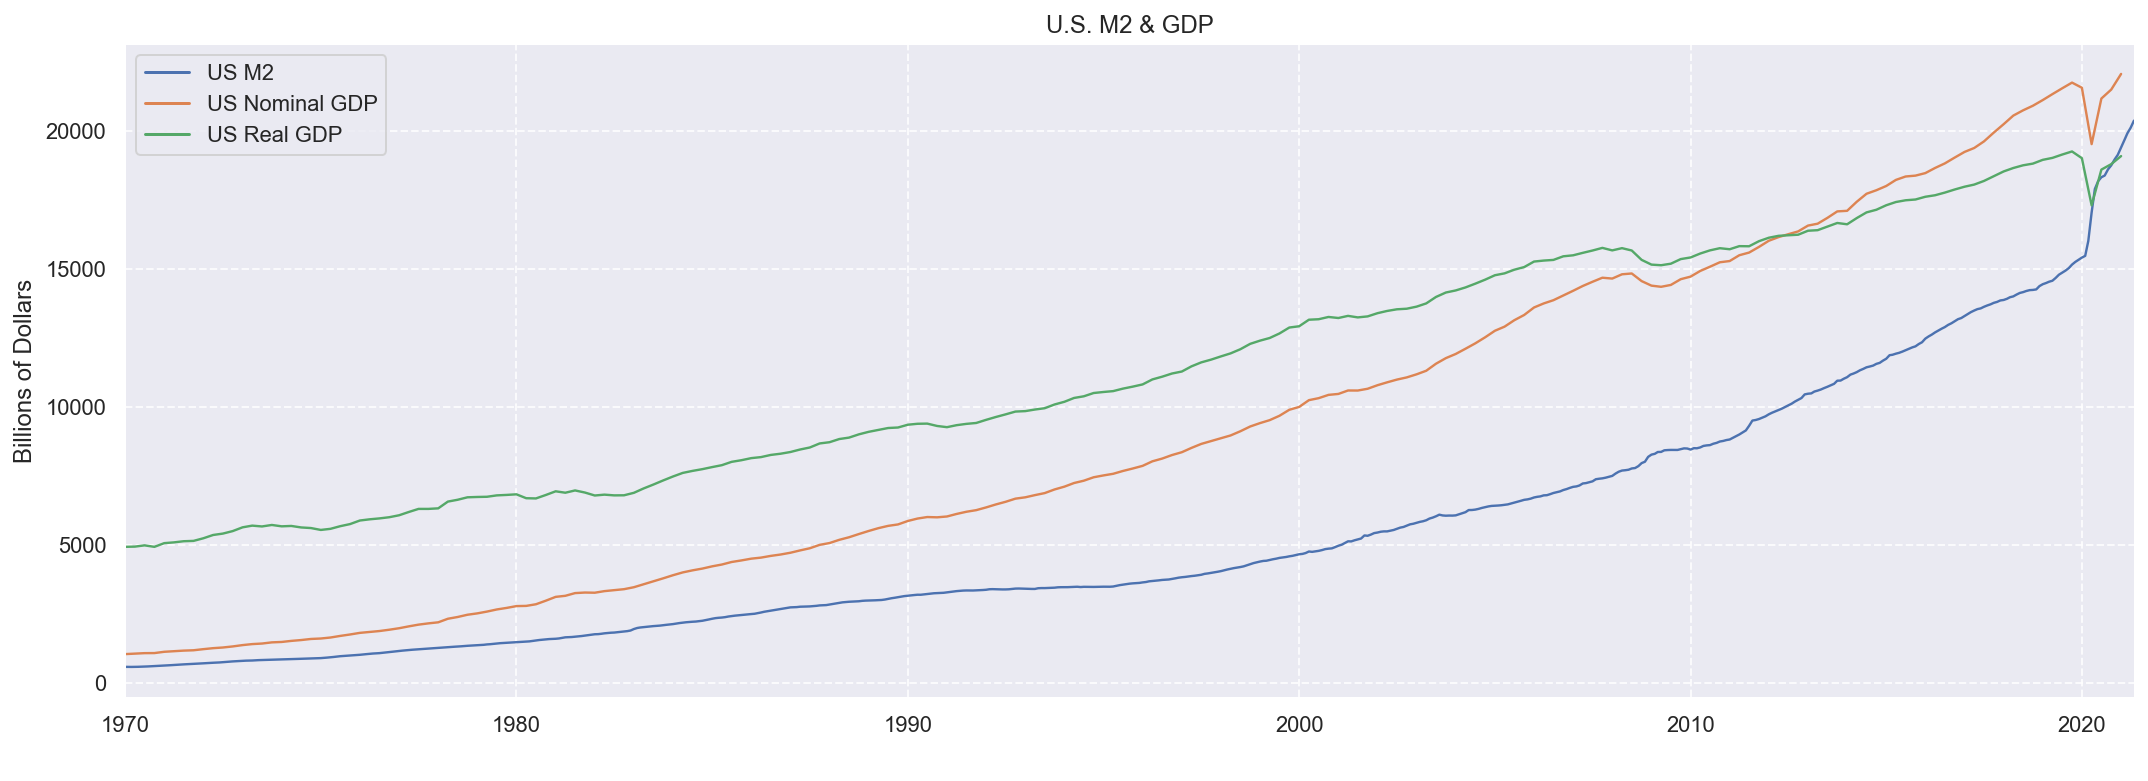
M2 Money Stock
The non-seasonally adjusted version of this weekly series: https://fred.stlouisfed.org/series/WM2NS
https://fred.stlouisfed.org/series/M2SL
Gross Domestic Product
Gross domestic product (GDP), the featured measure of U.S. output, is the market value of the goods and services produced by labor and property located in the United States. https://fred.stlouisfed.org/series/GDP
Real Gross Domestic Product
Real gross domestic product is the inflation adjusted value of the goods and services produced by labor and property located in the United States.
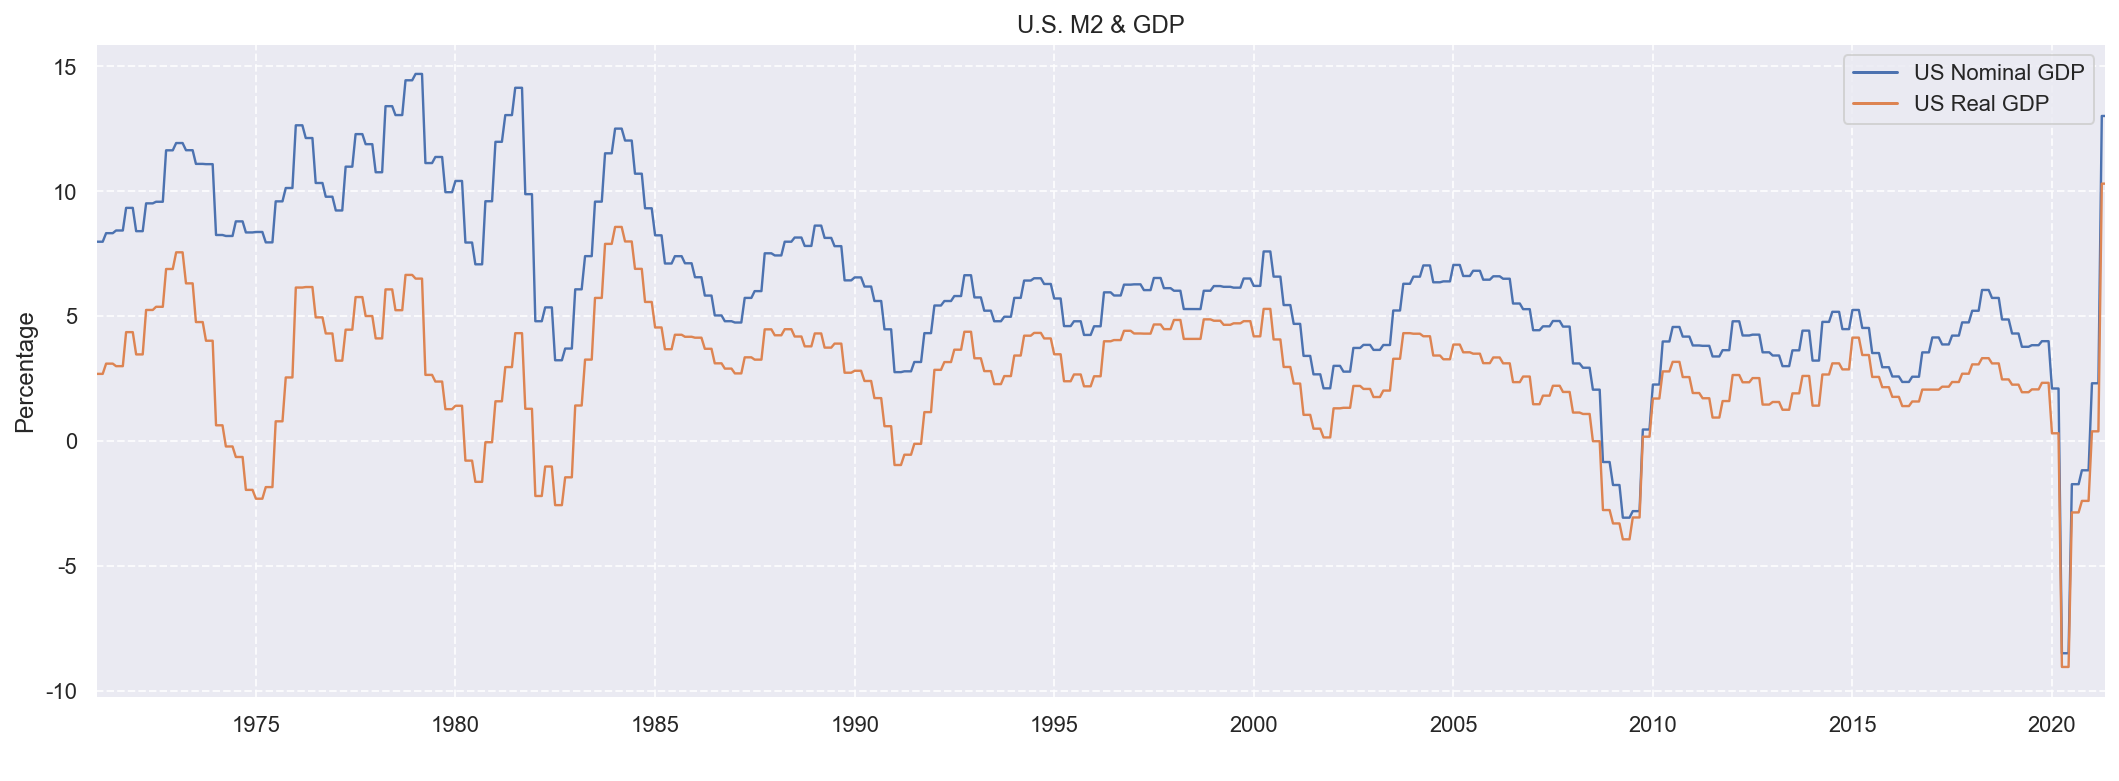
Is nominal GDP always higher than real GDP?
GDP增长(TTM)
利率
长期趋势
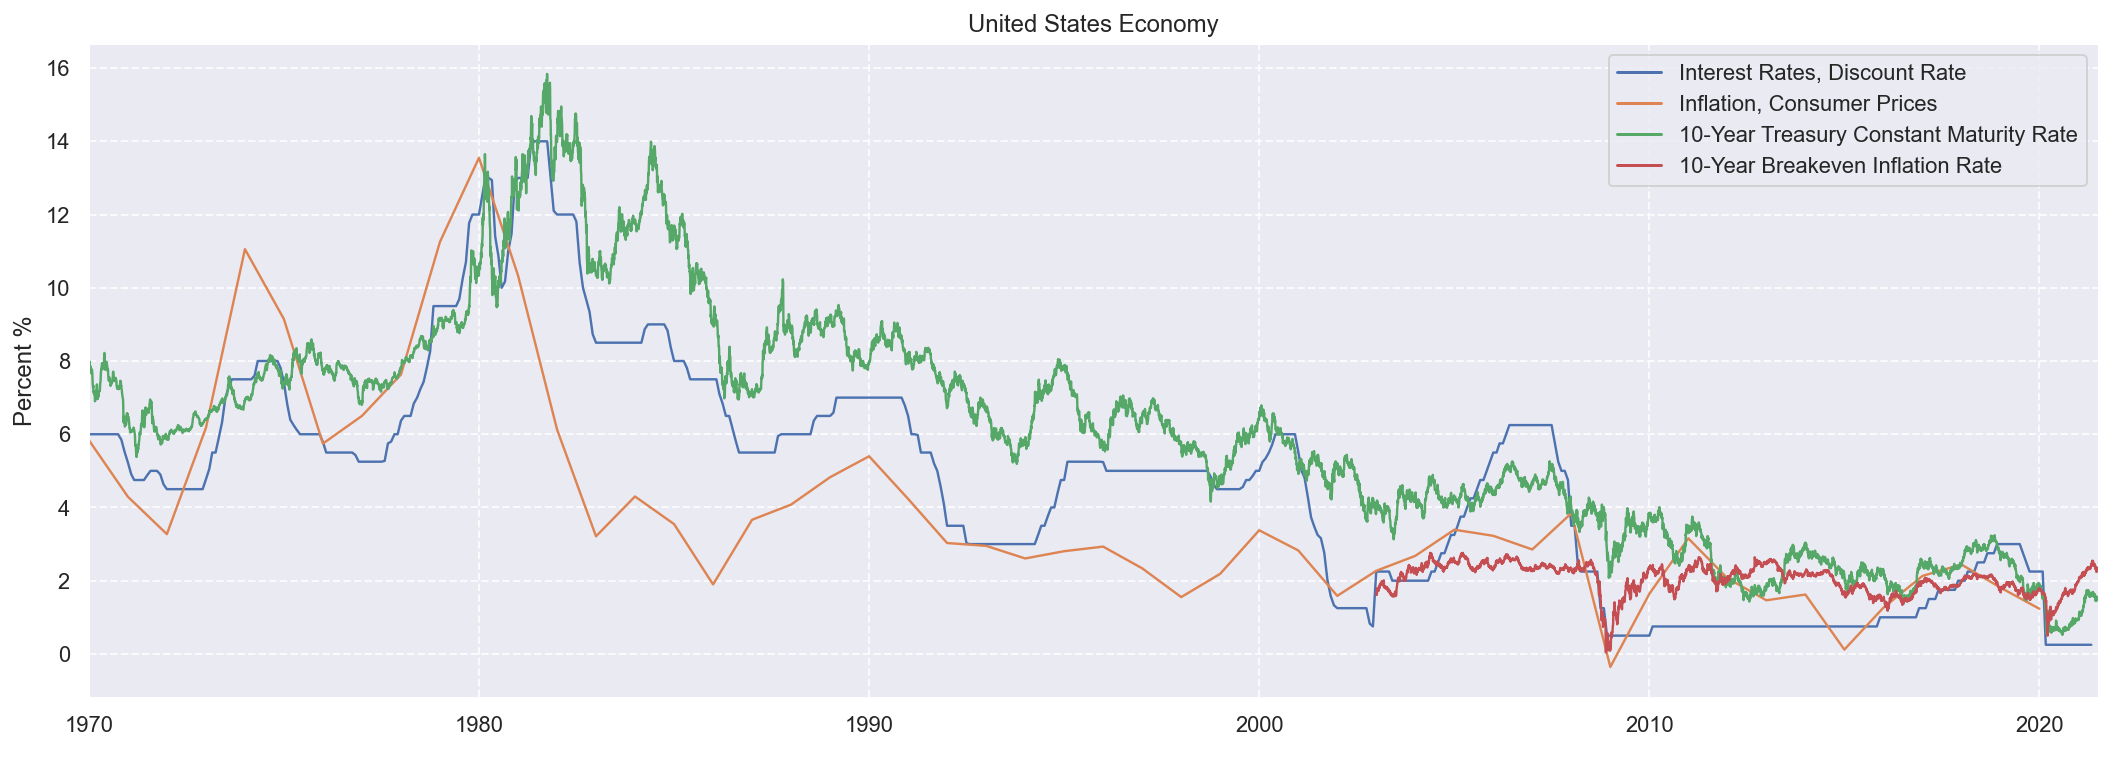
相关性
| Interest Rates, Discount Rate | Inflation, Consumer Prices | 10-Year Treasury Constant Maturity Rate | 10-Year Breakeven Inflation Rate | |
|---|---|---|---|---|
| Interest Rates, Discount Rate | 1.00 | 0.75 | 0.91 | 0.48 |
| Inflation, Consumer Prices | 0.75 | 1.00 | NaN | NaN |
| 10-Year Treasury Constant Maturity Rate | 0.91 | NaN | 1.00 | 0.54 |
| 10-Year Breakeven Inflation Rate | 0.48 | NaN | 0.54 | 1.00 |
短期趋势
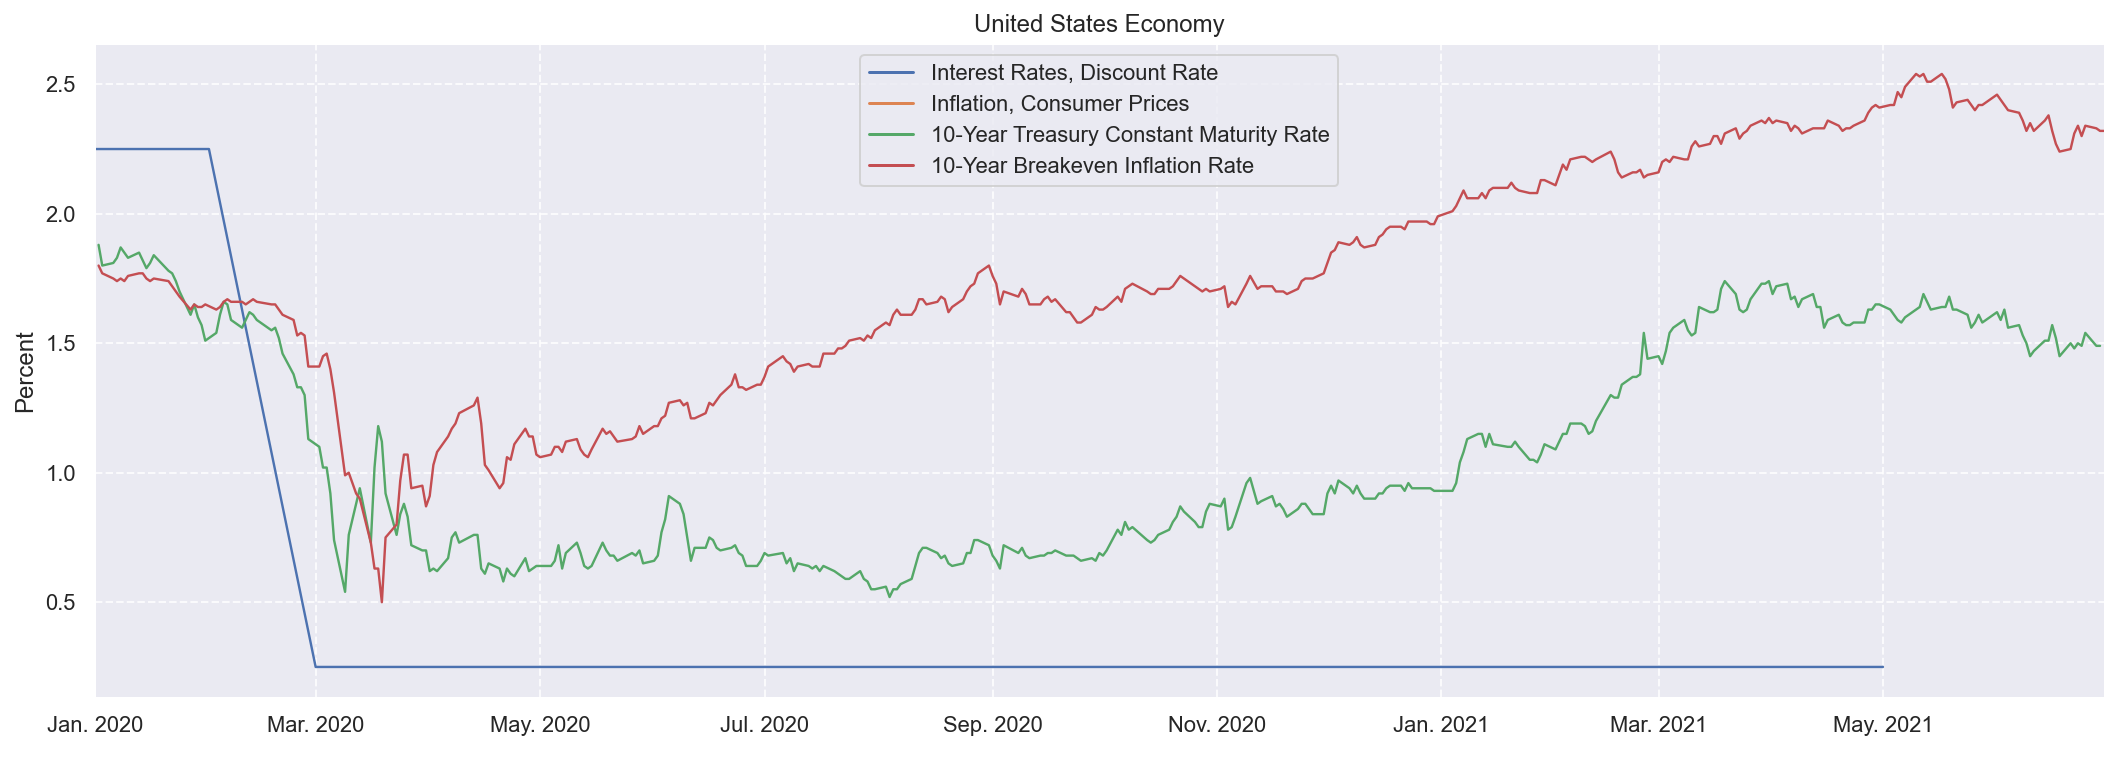
Inflation, consumer prices for the United States
Inflation as measured by the consumer price index reflects the annual percentage change in the cost to the average consumer of acquiring a basket of goods and services that may be fixed or changed at specified intervals, such as yearly. The Laspeyres formula is generally used.
International Monetary Fund, International Financial Statistics and data files.
10-Year Breakeven Inflation Rate
The breakeven inflation rate represents a measure of expected inflation derived from 10-Year Treasury Constant Maturity Securities (BC_10YEAR) and 10-Year Treasury Inflation-Indexed Constant Maturity Securities (TC_10YEAR). The latest value implies what market participants expect inflation to be in the next 10 years, on average. Starting with the update on June 21, 2019, the Treasury bond data used in calculating interest rate spreads is obtained directly from the U.S. Treasury Department.
M2增速与通胀预期
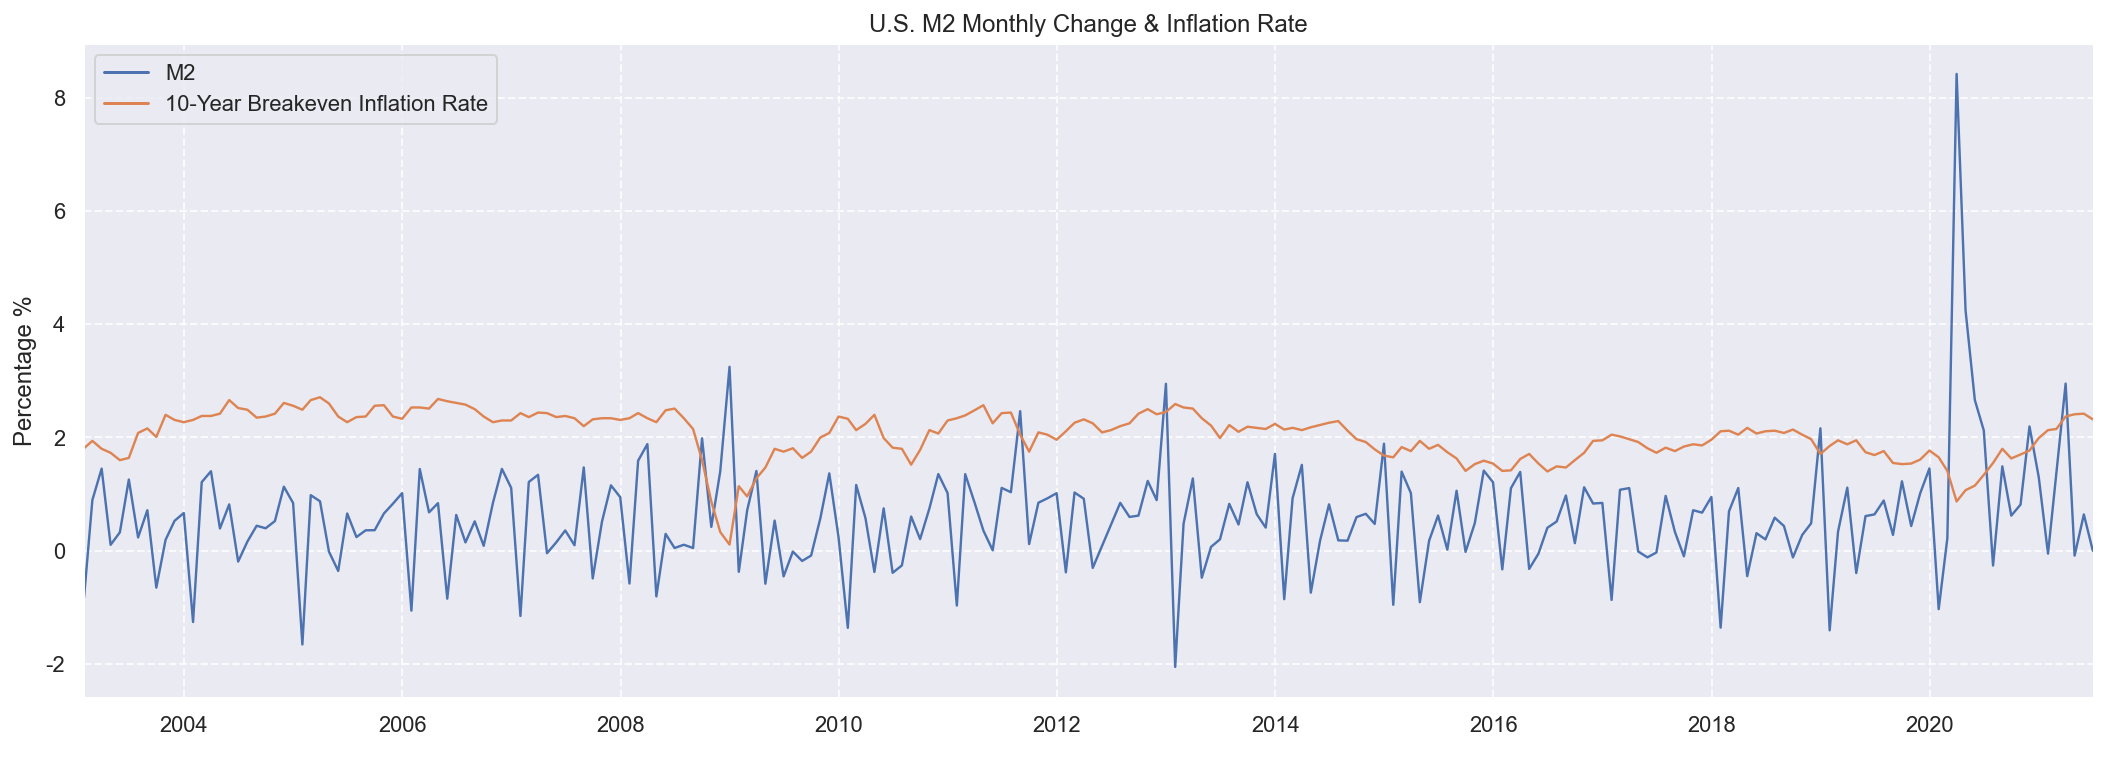
| M2 | 10-Year Breakeven Inflation Rate | |
|---|---|---|
| M2 | 1.00 | -0.26 |
| 10-Year Breakeven Inflation Rate | -0.26 | 1.00 |
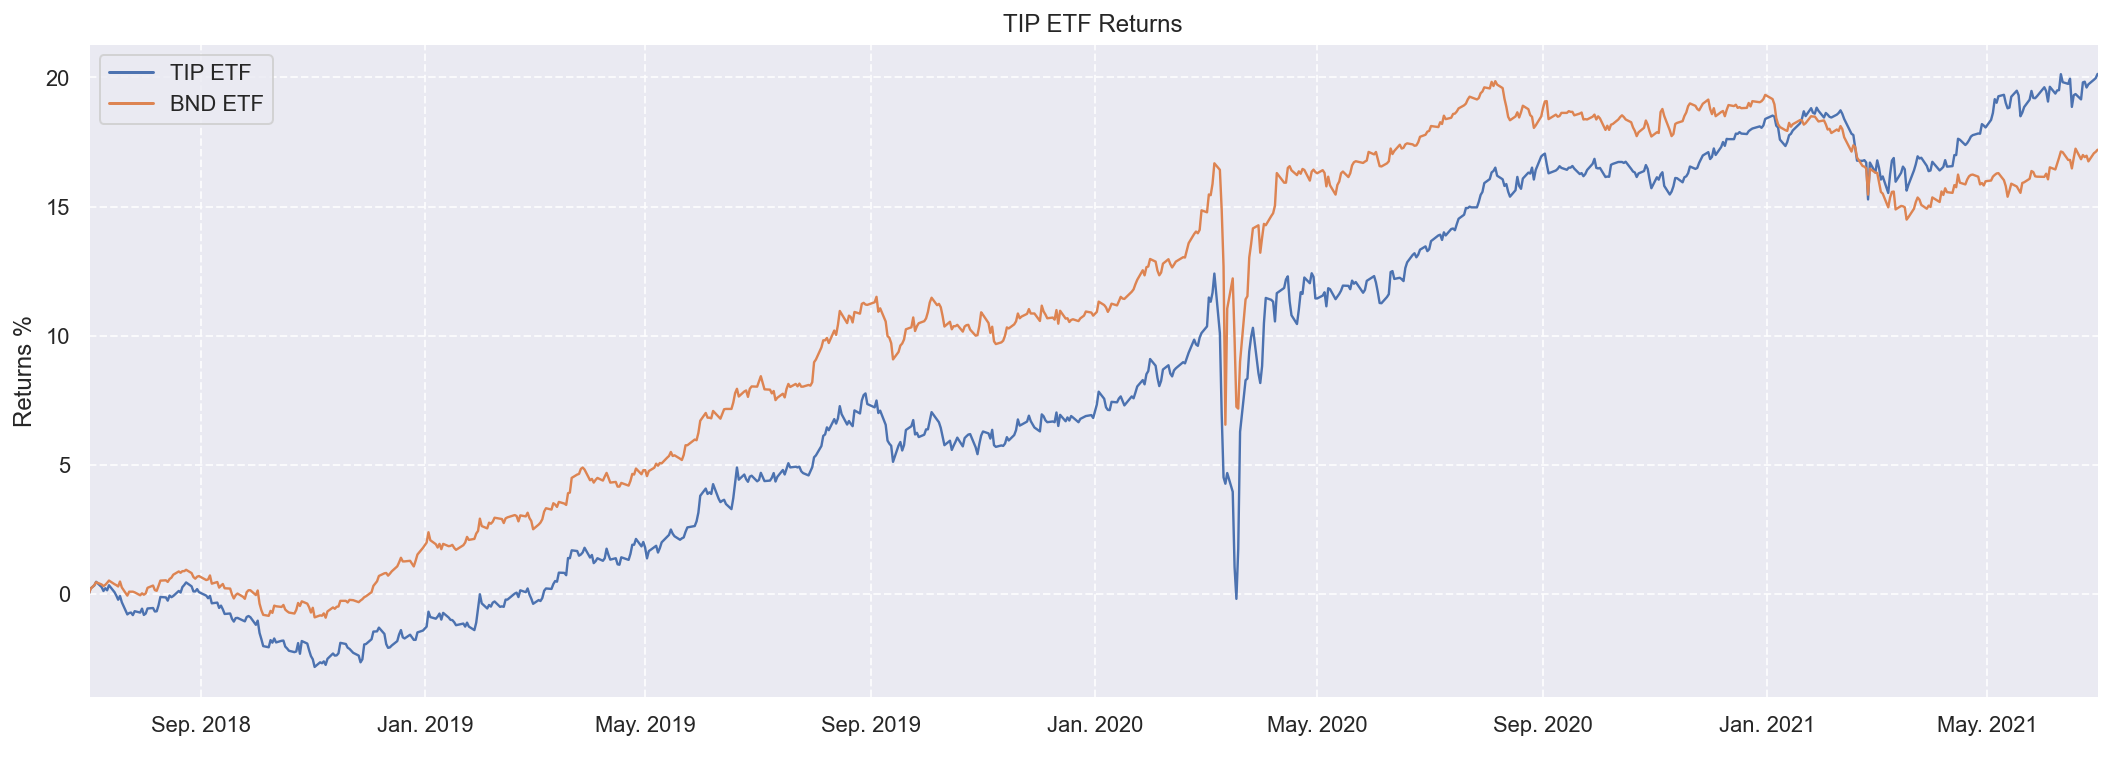
资产价格
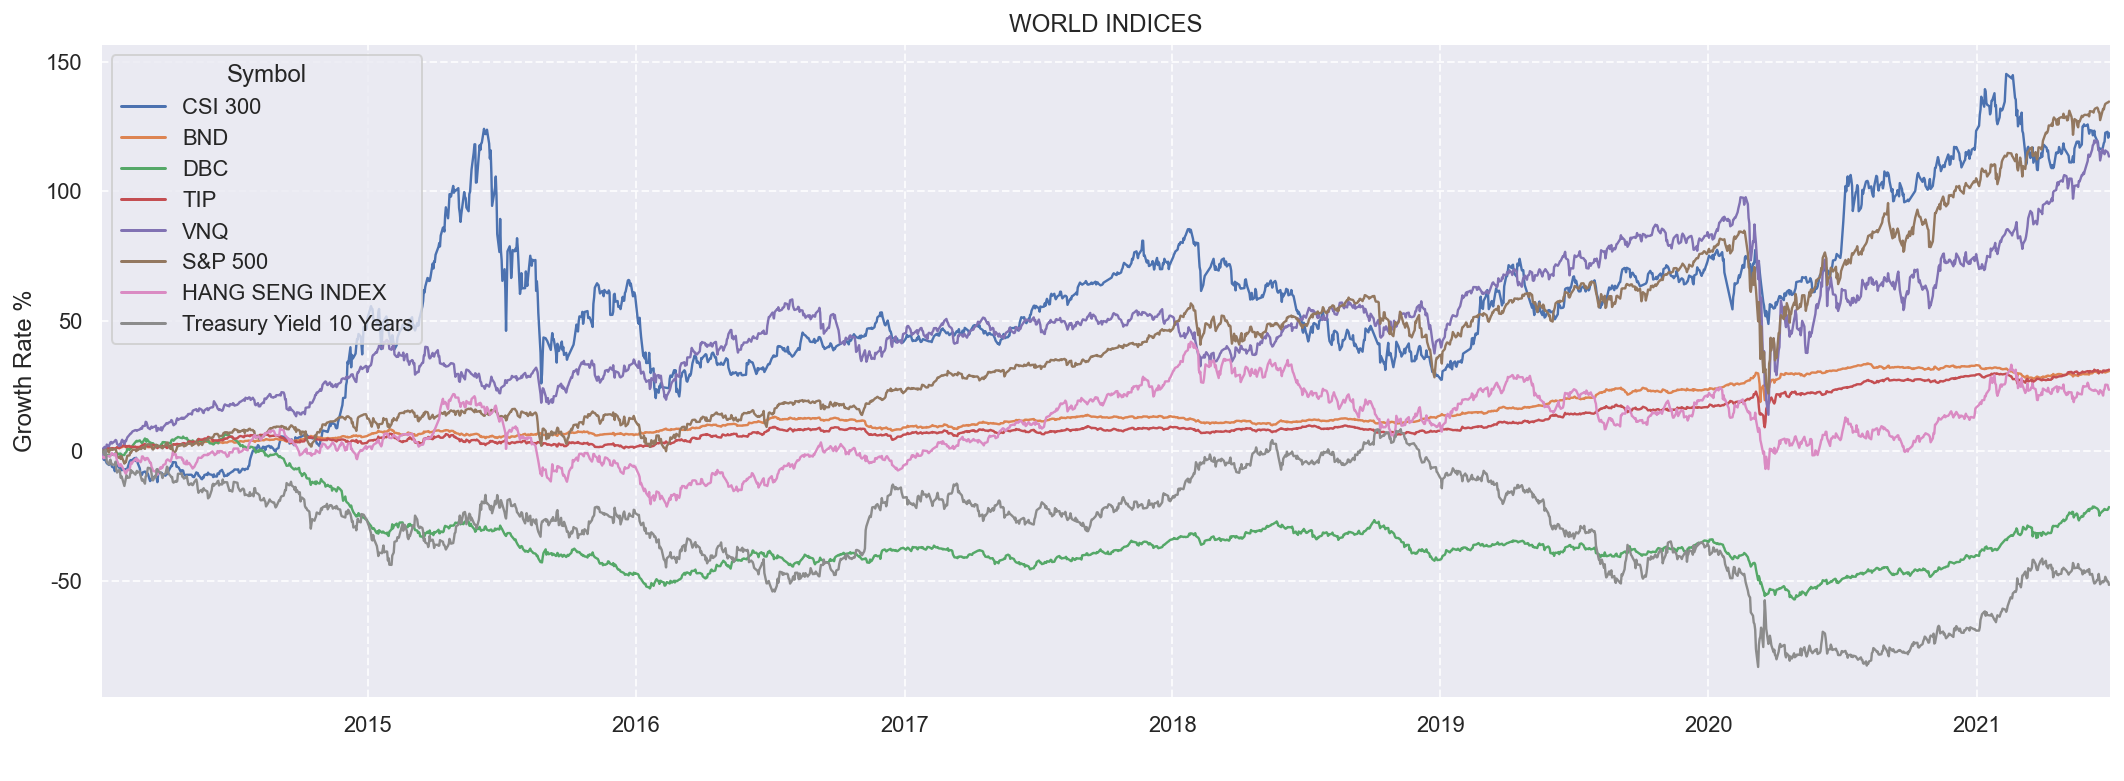
| Symbol | CSI 300 | BND | DBC | TIP | VNQ | S&P 500 | HANG SENG INDEX | Treasury Yield 10 Years |
|---|---|---|---|---|---|---|---|---|
| Symbol | ||||||||
| CSI 300 | 1.00 | 0.74 | -0.52 | 0.73 | 0.70 | 0.78 | 0.56 | -0.52 |
| BND | 0.74 | 1.00 | -0.50 | 0.97 | 0.83 | 0.89 | 0.37 | -0.76 |
| DBC | -0.52 | -0.50 | 1.00 | -0.32 | -0.43 | -0.29 | -0.01 | 0.49 |
| TIP | 0.73 | 0.97 | -0.32 | 1.00 | 0.81 | 0.92 | 0.38 | -0.73 |
| VNQ | 0.70 | 0.83 | -0.43 | 0.81 | 1.00 | 0.89 | 0.52 | -0.44 |
| S&P 500 | 0.78 | 0.89 | -0.29 | 0.92 | 0.89 | 1.00 | 0.62 | -0.44 |
| HANG SENG INDEX | 0.56 | 0.37 | -0.01 | 0.38 | 0.52 | 0.62 | 1.00 | 0.18 |
| Treasury Yield 10 Years | -0.52 | -0.76 | 0.49 | -0.73 | -0.44 | -0.44 | 0.18 | 1.00 |
S&P 500
S&P 500与GDP
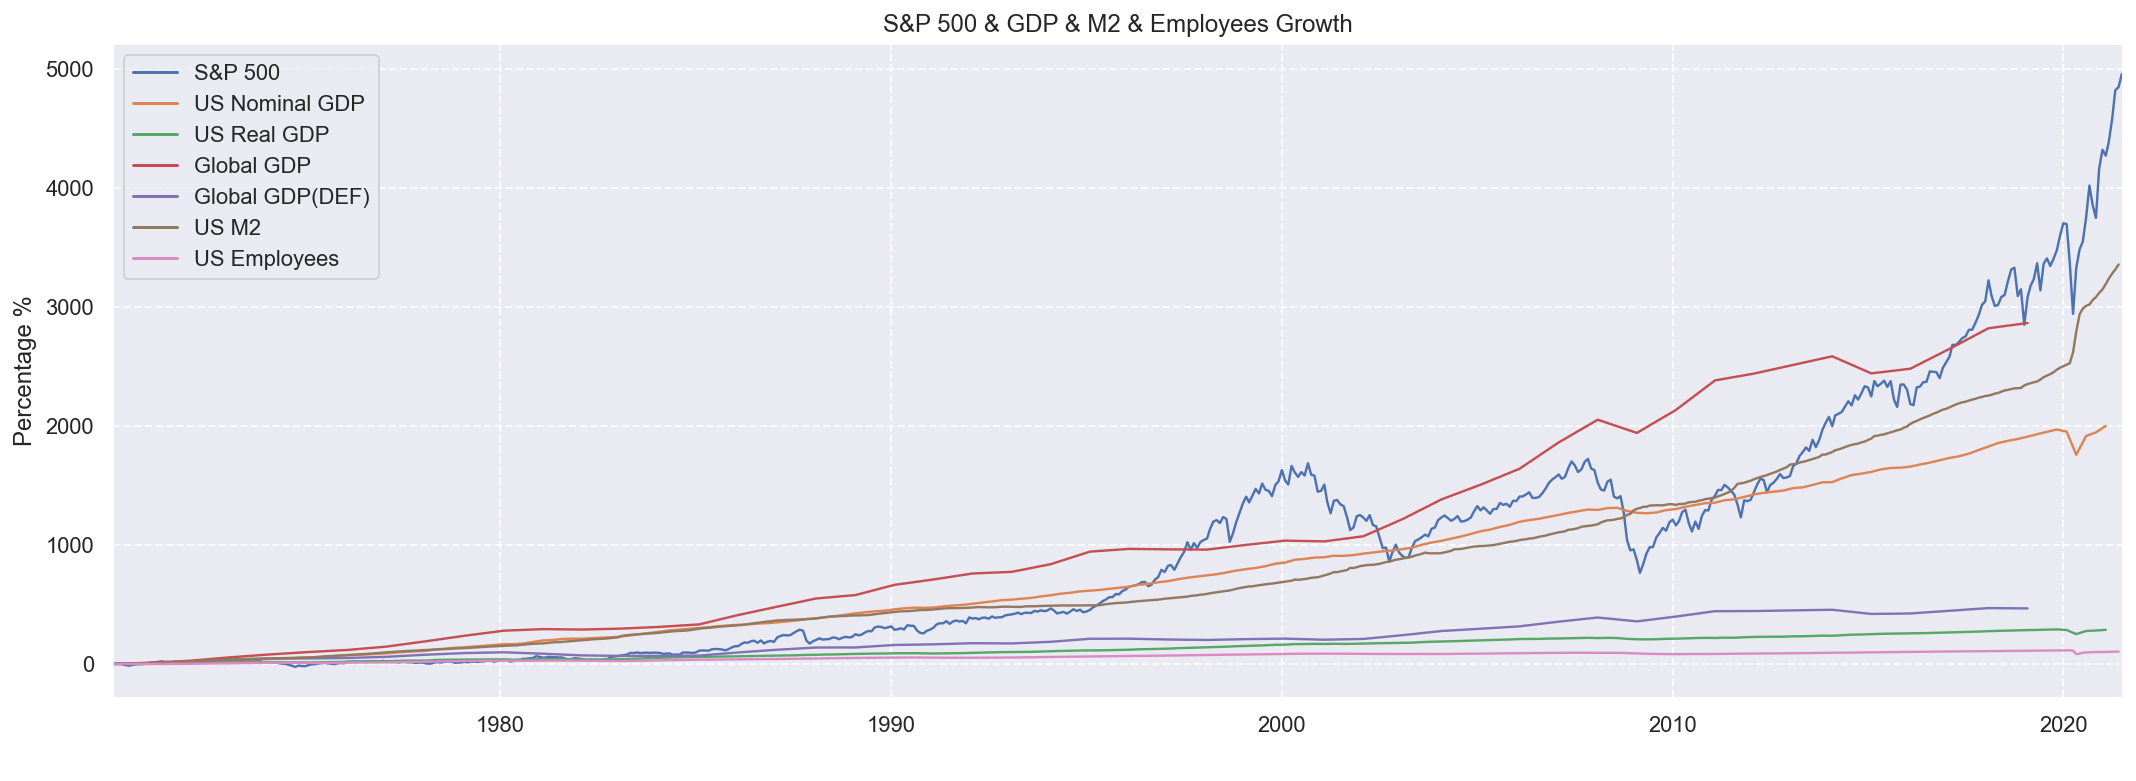
| S&P 500 | US Nominal GDP | US Real GDP | Global GDP | Global GDP(DEF) | US M2 | US Employees | |
|---|---|---|---|---|---|---|---|
| S&P 500 | 1.00 | 0.95 | 0.93 | 0.92 | 0.90 | 0.97 | 0.85 |
| US Nominal GDP | 0.95 | 1.00 | 0.99 | 0.99 | 0.98 | 0.97 | 0.94 |
| US Real GDP | 0.93 | 0.99 | 1.00 | 0.97 | 0.97 | 0.94 | 0.97 |
| Global GDP | 0.92 | 0.99 | 0.97 | 1.00 | 0.99 | 0.98 | 0.91 |
| Global GDP(DEF) | 0.90 | 0.98 | 0.97 | 0.99 | 1.00 | 0.96 | 0.92 |
| US M2 | 0.97 | 0.97 | 0.94 | 0.98 | 0.96 | 1.00 | 0.85 |
| US Employees | 0.85 | 0.94 | 0.97 | 0.91 | 0.92 | 0.85 | 1.00 |
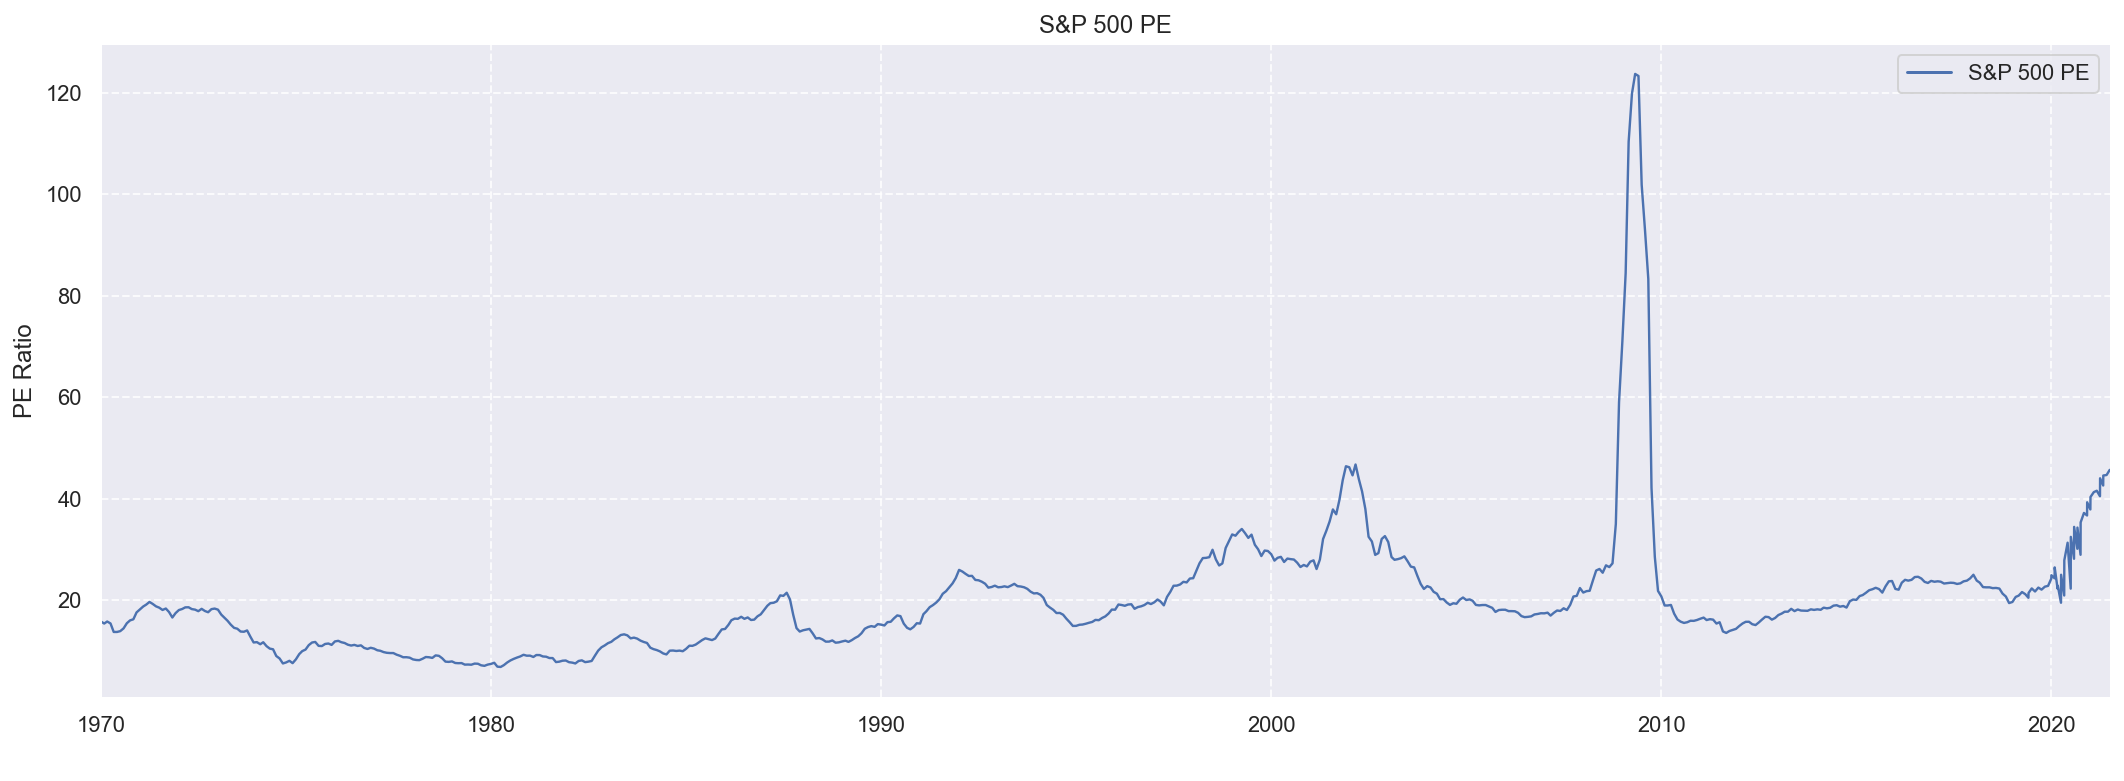
S&P 500 PE
| 2021-06-30 | |
|---|---|
| S&P 500 PE | 45.65 |
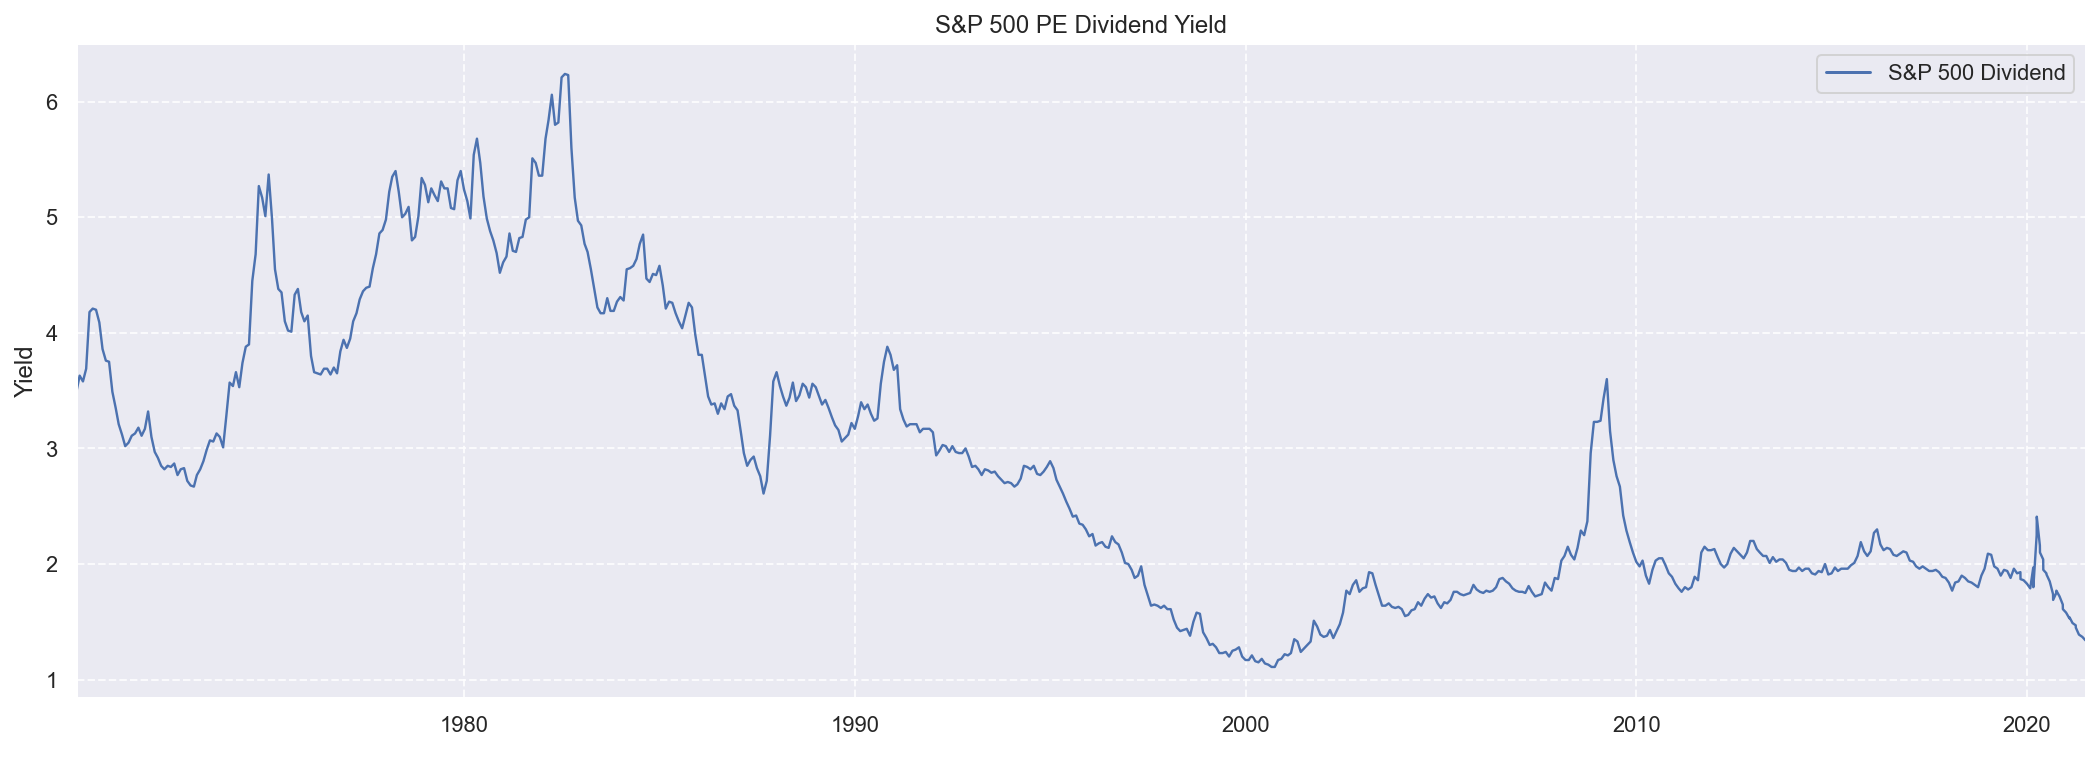
Dividend Yield
| 2021-06-30 | |
|---|---|
| S&P 500 Dividend | 1.34 |
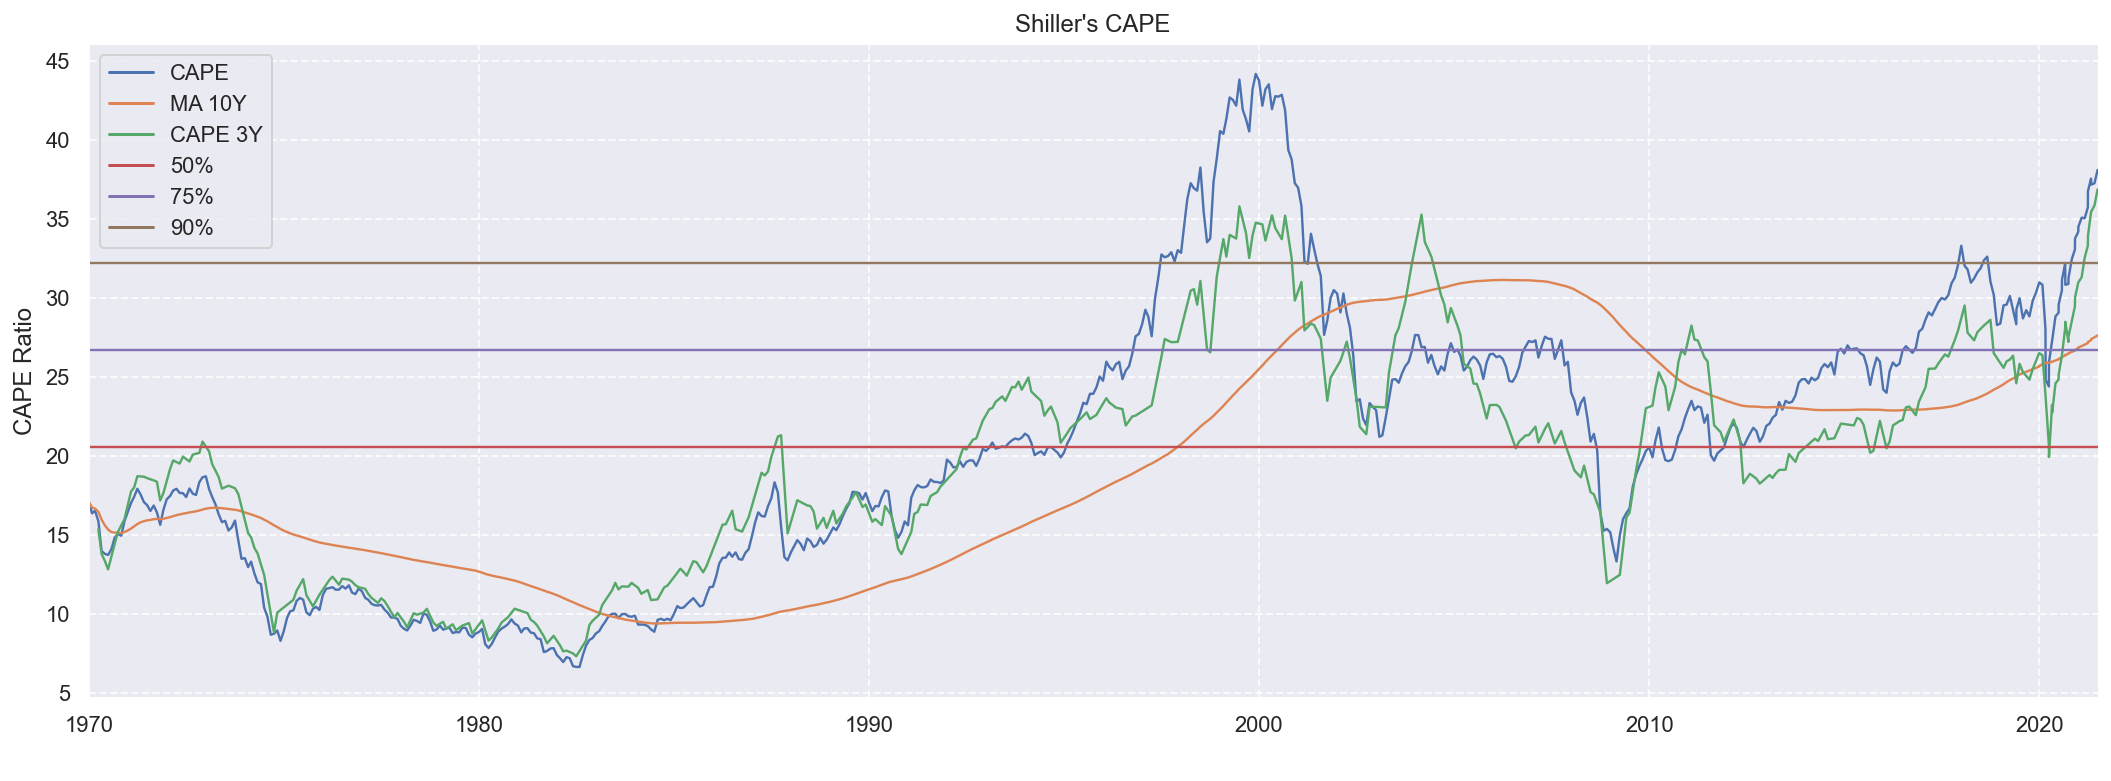
Shiller’s CAPE
| 2021-06-30 | |
|---|---|
| CAPE | 38.11 |
| MA 10Y | 27.63 |
| CAPE 3Y | 36.88 |
| 50% | 20.54 |
| 75% | 26.69 |
| 90% | 32.20 |
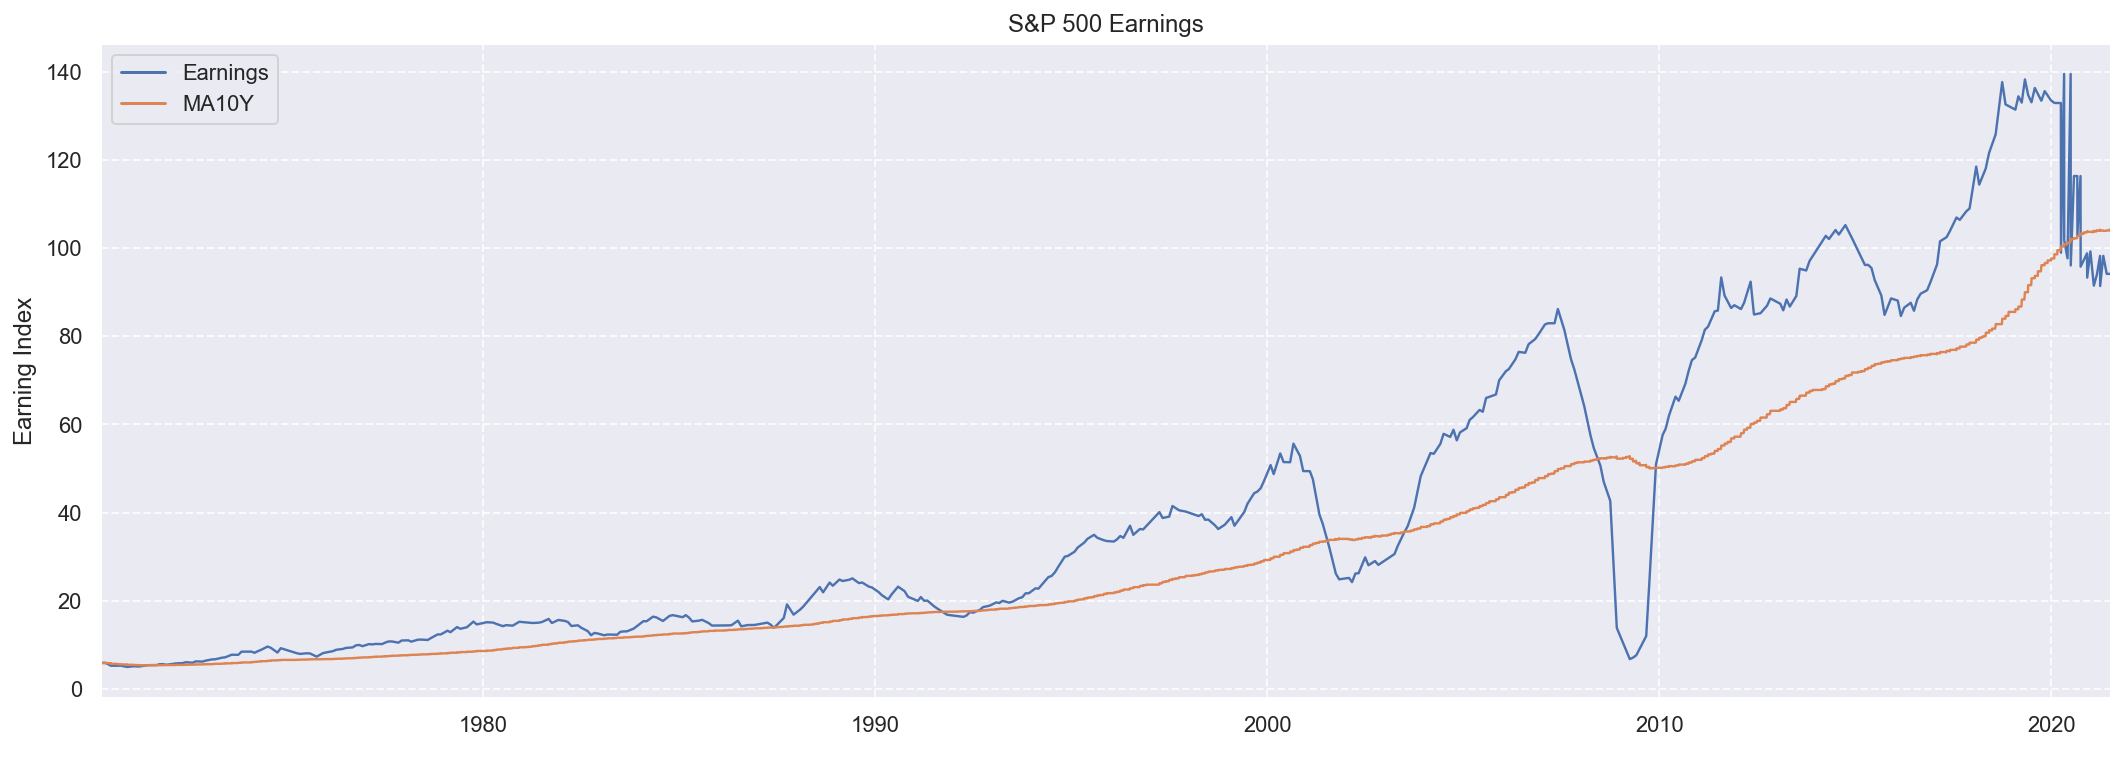
Earnings
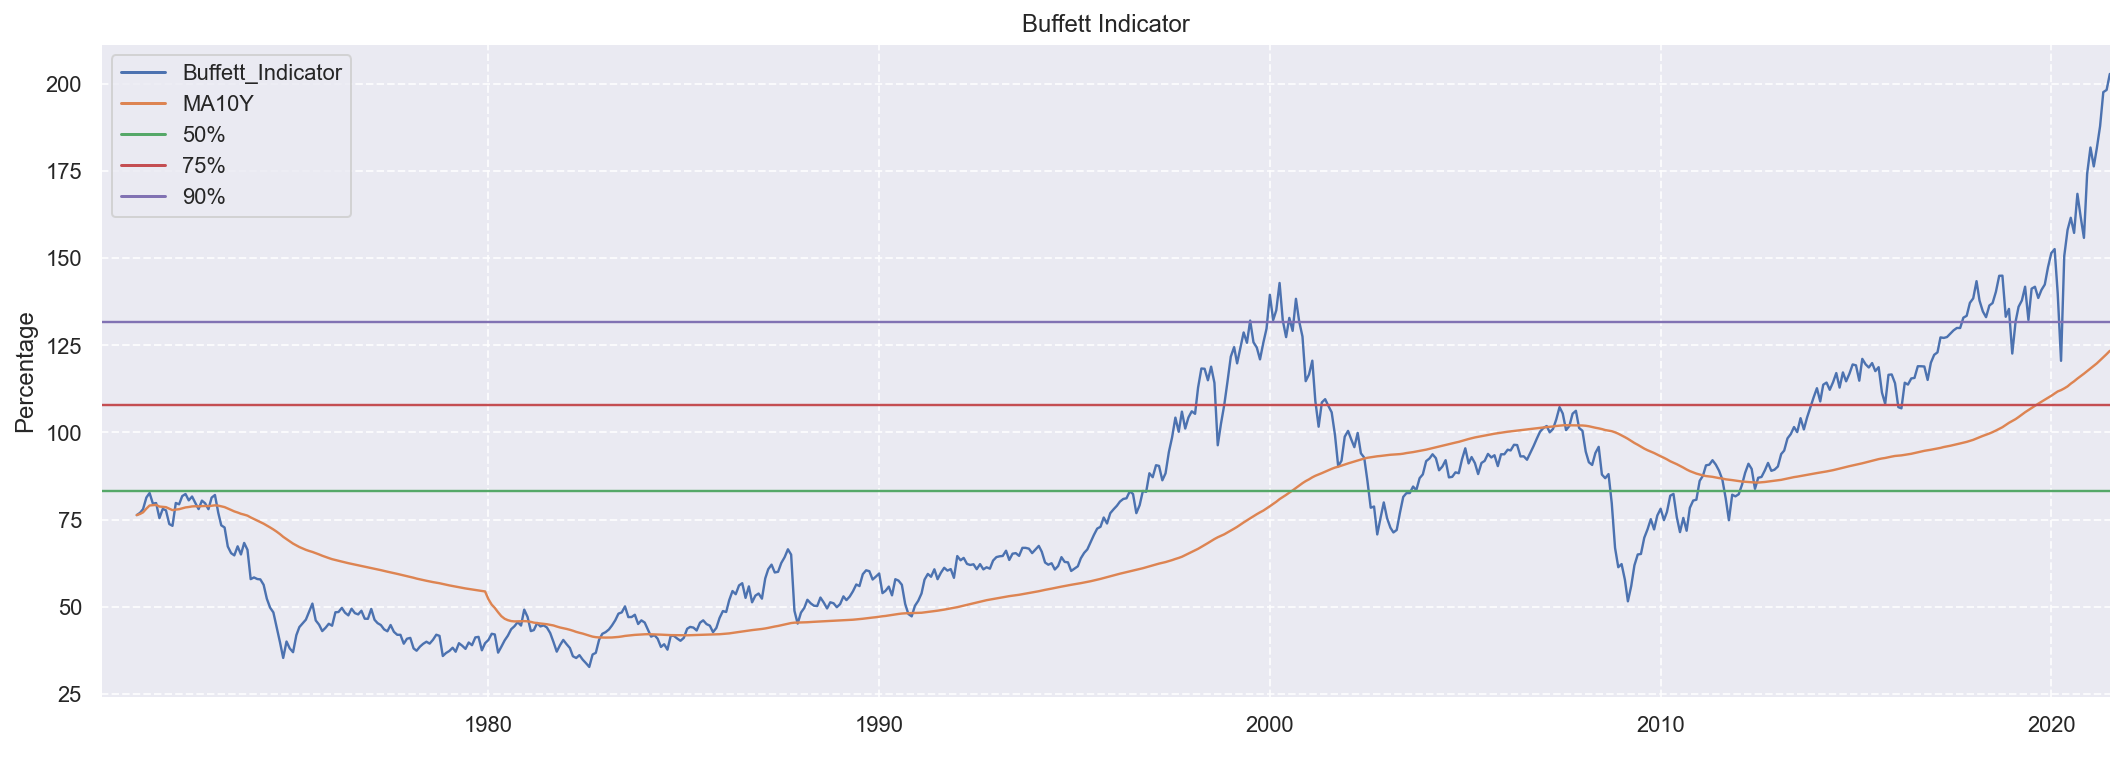
Buffett Indicator
| 2021-06-29 | |
|---|---|
| Buffett_Indicator | 202.95 |
| MA10Y | 123.43 |
| 50% | 83.30 |
| 75% | 107.96 |
| 90% | 131.69 |
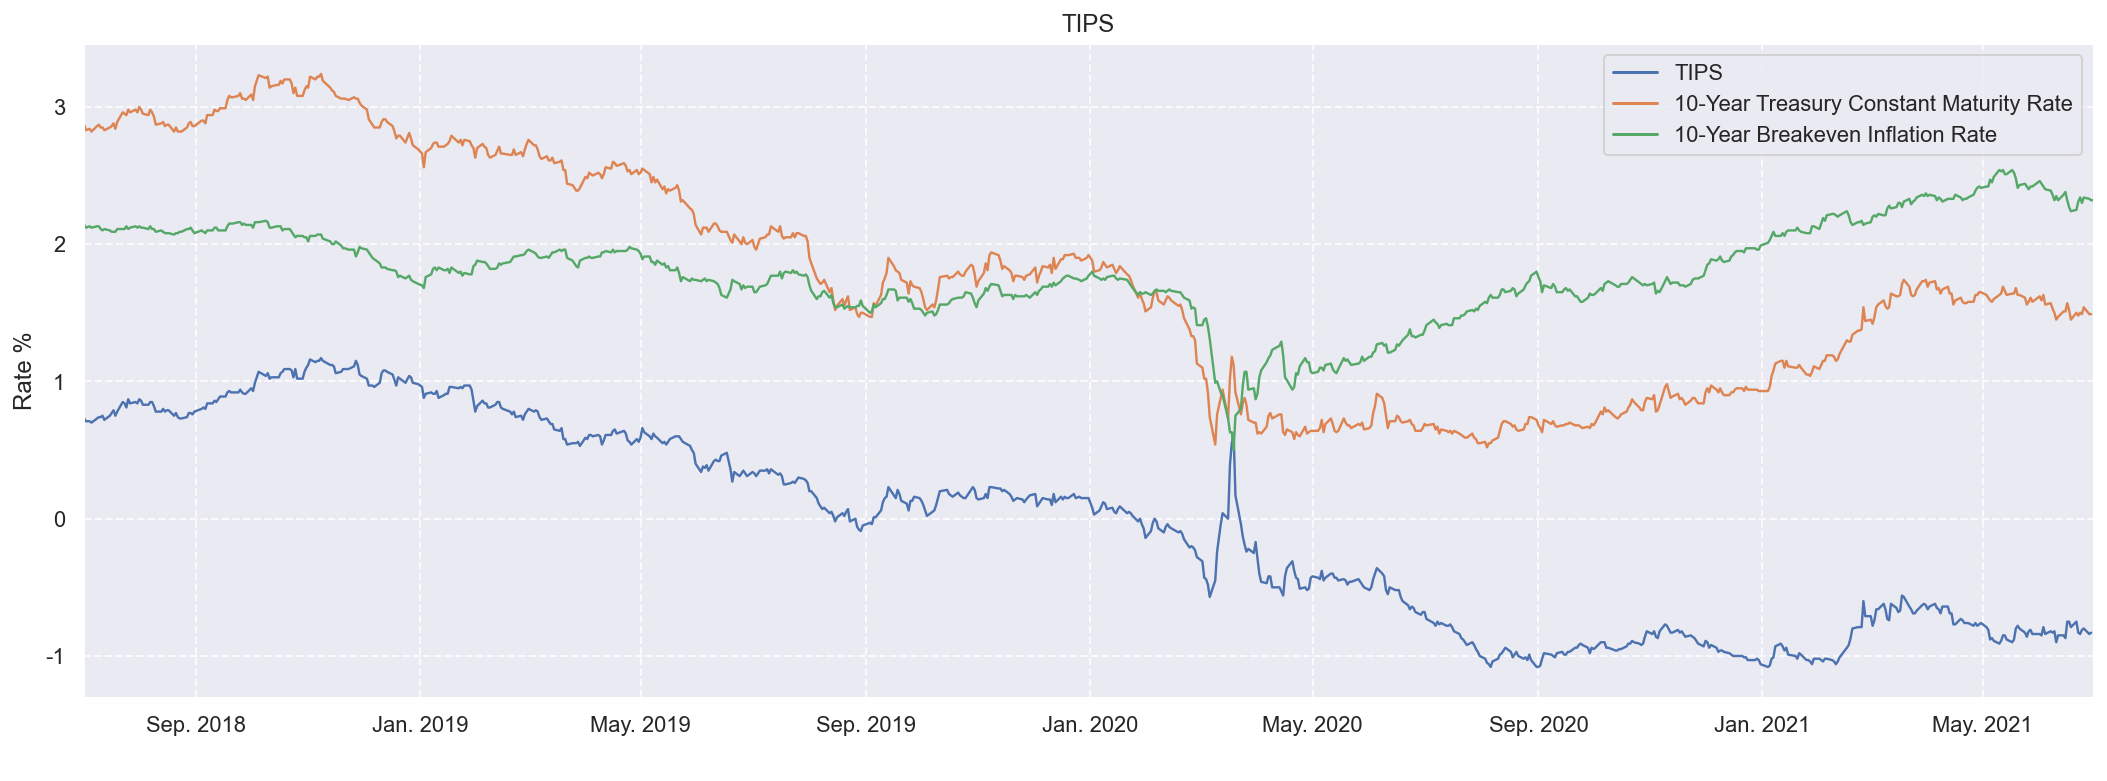
TIPS
| 2021-06-29 | |
|---|---|
| TIPS | -0.83 |
| 10-Year Treasury Constant Maturity Rate | 1.49 |
| 10-Year Breakeven Inflation Rate | 2.32 |